By Jerry Avenaim | FOUNDER |
This blog post will take a closer look at mental health statistics since it is such an key area to focus on as we continue our approach towards Mental Health Awareness month. Some of our readers are already familiar with the topic, but for others much of this information may be new, and in order to help people understand the impact of mental health conditions on ourselves, our families, communities, and the country as a whole, it is important to take a look at some of the findings from nationwide studies.
Through being exposed to this information, readers will become more aware, and it will help them become more effective in raising awareness to change individual and collective mindsets as well as influence policy and care.
Good mental health is the cornerstone to being a complete and healthy individual, and raising awareness is crucial in the reduction of the stigma associated with mental health issues and mental health care. This creates an environment which allows greater social freedoms to the individual who suffers, along with their family and friends to talk about their condition and seek proper care.
High Level Mental Health Statistics
1 in 5 adults live with a mental illness
Almost 1 in 25 adults live with a serious mental illness
50% of chronic mental illness start before 14 years of age
75% of chronic mental illness start by age 24
Just over 10 million people over the age of 18 have more than 1 addiction or mental health disorder
COVID-19 and Mental Health Statistics
In current terms, assessing Americans responses to the global COVID-19 pandemic, surveys conducted in the first 3 months by Cohen Veterans Network revealed the following:
- 73% (or nearly 3 in 4) healthcare providers feel their families life is at risk because of their job during the pandemic
- 58% (almost 6 in 10) frontline healthcare providers in NY city are concerned for their own mental health
- 29% (almost 3 in 10) frontline healthcare providers in NY city feel scared
- 7 in 10 Americans expressed worry over their health because of COVID-19
- 58% believe social distancing is a reason to be concerned about their mental health
- 64% of people indicated feeling anxious in general because of the pandemic
- Only 14% of families have taken advantage of mental health care because of issues related to the pandemic
- Between the military and their families, over 50% have looked for mental health care

In other surveys about mental health care, the Cohen Veterans Network found that:
- 25.8% (96 million) people have experienced waiting periods of more than a week for the right mental health care
- 25% of people have been faced with making a decision between daily necessities and paying for mental health care
- 46% either know someone who has, or they themselves have had to travel for more than an hour to get to and from recent appointments for mental health care
- 76% believe that their mental health is equally as important as their physical health
- 52% of those in need of mental health care have tried to tough it out instead of seeking appropriate mental health care
- 46% would not know where to go to get mental health care for themselves or for someone else unless they had previously sought treatment.
Check out our other articles about COVID-19 and mental health:
Categories of Mental Health Disorder
Overall, mental illness includes many different disorders or conditions, and people experience these conditions on a scale from moderate to severe. The main classifications are:
- AMI – Any Mental Illness
- SMI – Serious Mental Illness
Within these two classifications, the following charts from the National Institute of Mental Health website, and maps from SAMHDA found on the SAMHSA.gov website show survey data broken out by state as well as by age, gender and race.
Any Mental Illness
With Any Mental Illness, the resulting impact to the person from the mental, behavioral or emotional disorder can be no impairment, mild impairment, moderate impairment or severe impairment.
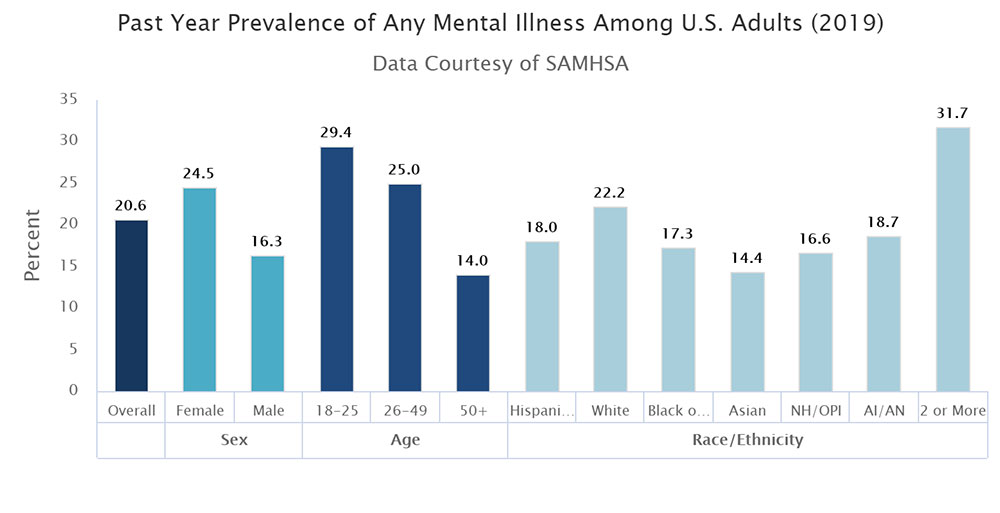
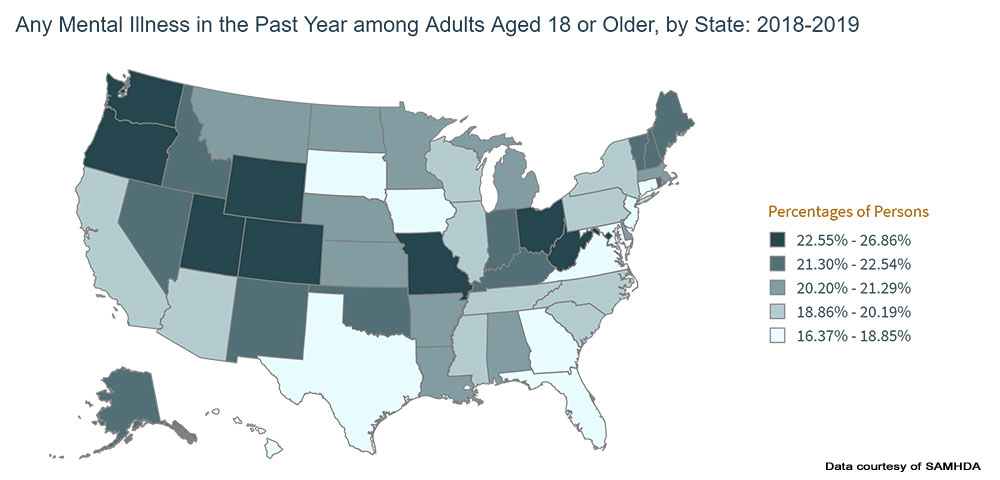
Any Mental Illness Prevalence Summary
Overall 20% of US adults aged 18 or older had some form of mental illness in the previous 12 months.
- Gender
- Highest incidence – females at 24.5%
- Lowest incidence – males at 16.3% (
- Difference between high and low – 50.3%
- Age
- Highest incidence – 18 to 25 at 29.4%
- Lowest incidence – 50 + at 14.0%
- Difference between high and low – 109.9%
- Race
- Highest incidence – 2 or more races at 31.7%
- Lowest incidence – Asian + at 14.4%
- Difference between high and low – 120.1%
- By State
- Highest incidence – Utah 26.9%
- Lowest incidence – New Jersey + at 16.4%
- Difference between high and low – 64.0%
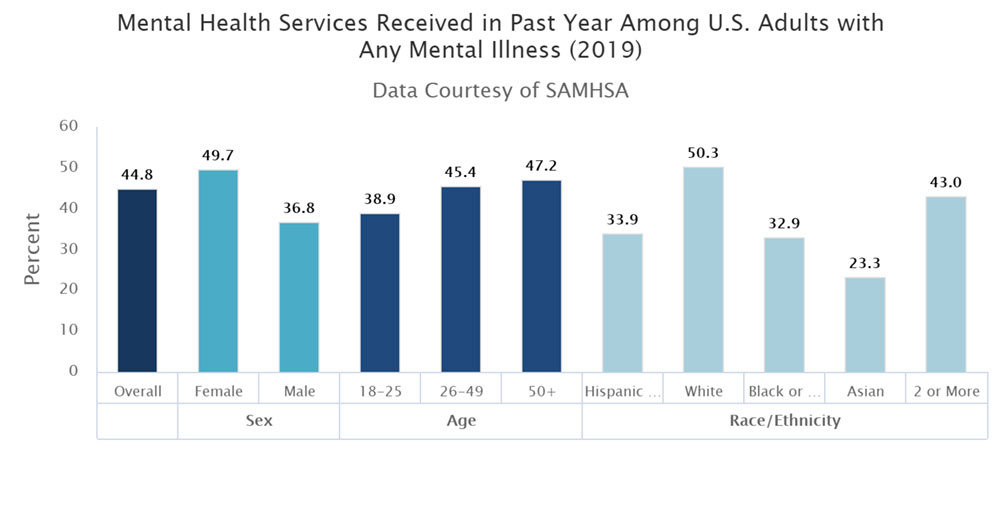
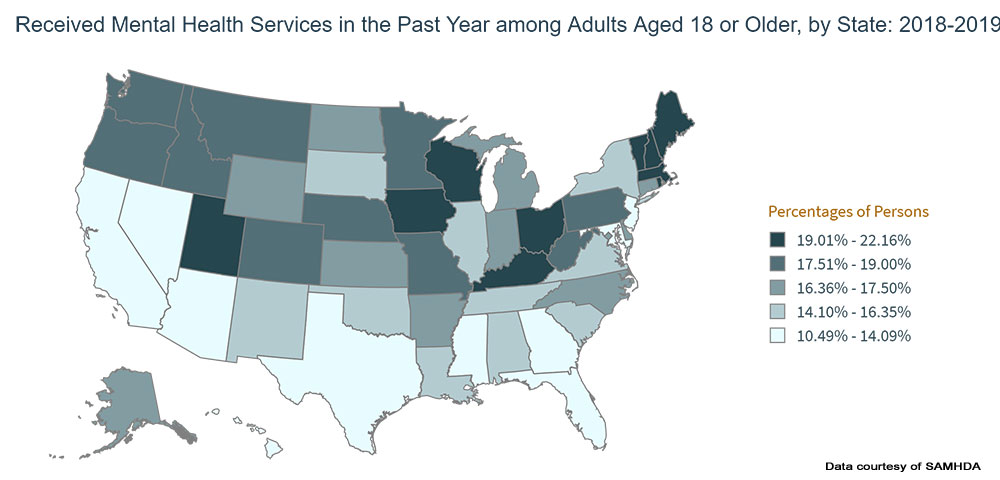
Any Mental Illness Services Received Summary
Overall 44.8% of US adults aged 18 or older with Any Mental Illness received mental health services in the previous 12 months.
- Gender
- Highest incidence – females at 49.7%
- Lowest incidence – males at 36.8%
- Difference between high and low – 35.0%
- Age
- Highest incidence – 50 + at 47.2%
- Lowest incidence – 18 to 25 at 38.9%
- Difference between high and low – 21.3%
- Race
- Highest incidence – White at 50.3%
- Lowest incidence – Asian + at 23.3%
- Difference between high and low – 115.9%
- By State
- Highest incidence – Vermont 22.2%
- Lowest incidence – Hawaii at 10.5%
- Difference between high and low – 111.4%
Serious Mental Illness
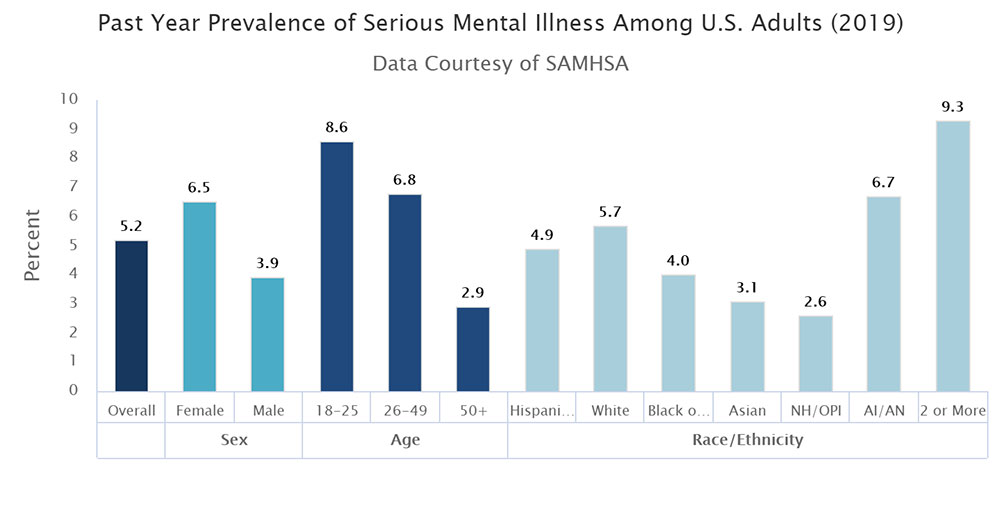
The definition of Serious Mental Illness is where one or more of the individual’s major life activities are limited substantially or there is serious functional impairment.
Serious Mental Illness Prevalence Summary
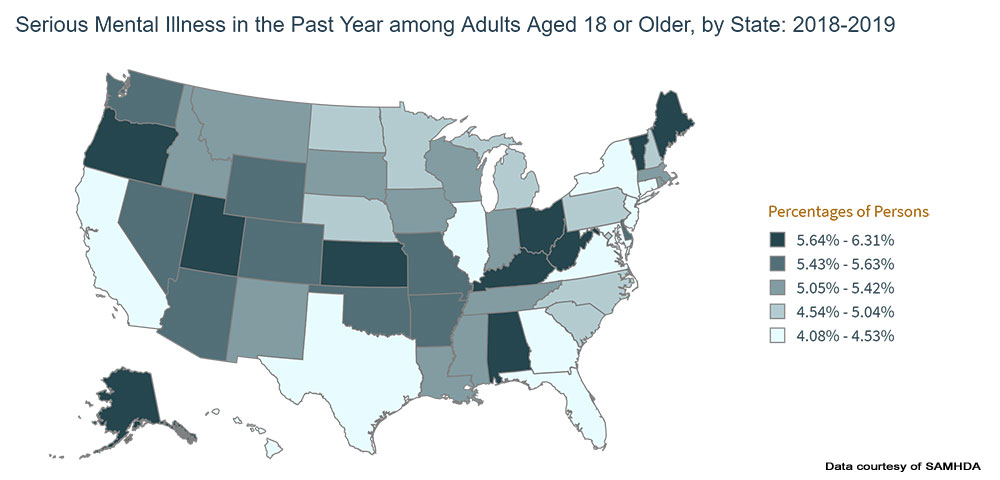
Overall 5.2% of US adults aged 18 or older had some form of serious mental illness in the previous 12 months.
- Gender
- Highest incidence – females at 6.5%
- Lowest incidence – males at 3.9% (
- Difference between high and low – 66.7%
- Age
- Highest incidence – 18 to 25 at 8.6%
- Lowest incidence – 50 + at 2.9%
- Difference between high and low – 196.6%
- Race
- Highest incidence – 2 or more races at 9.3%
- Lowest incidence – Native Hawaiian / Other Pacific Islander at 2.6%
- Difference between high and low – 257.7%
- By State
- Highest incidence – Utah 6.3%
- Lowest incidence – New Jersey + at 4.1%
- Difference between high and low – 53.7%
Serious Mental Illness Services Received Summary
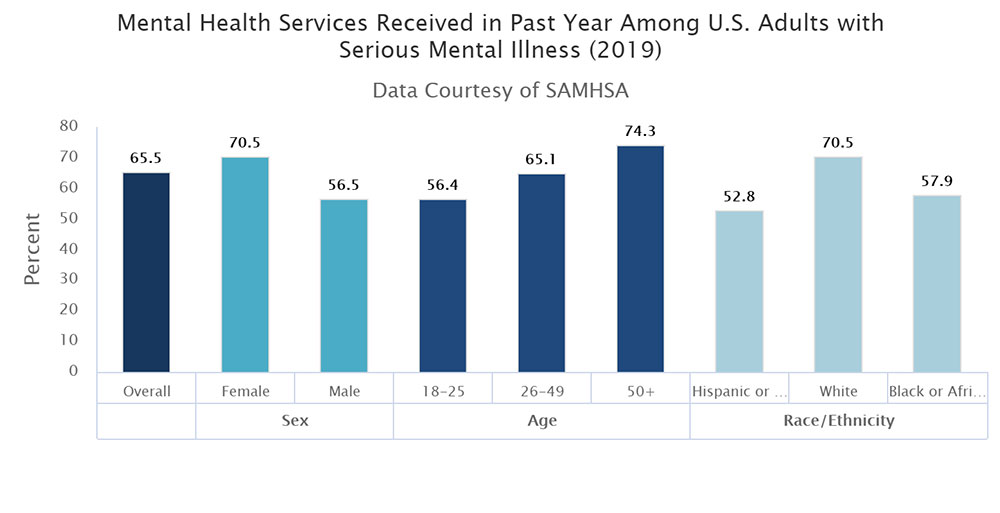
Overall 65.5% of US adults with Serious Mental Illness received mental health services in the previous 12 months.
- Gender
- Highest incidence – females at 70.5%
- Lowest incidence – males at 56.5% (
- Difference between high and low – 24.8%
- Age
- Highest incidence – 50 + at 74.3%
- Lowest incidence – 18 to 25 at 56.4%
- Difference between high and low – 31.7%
- Race
- Highest incidence – White at 70.5%
- Lowest incidence – Hispanic or Latino at 52.8%
- Difference between high and low – 33.5%
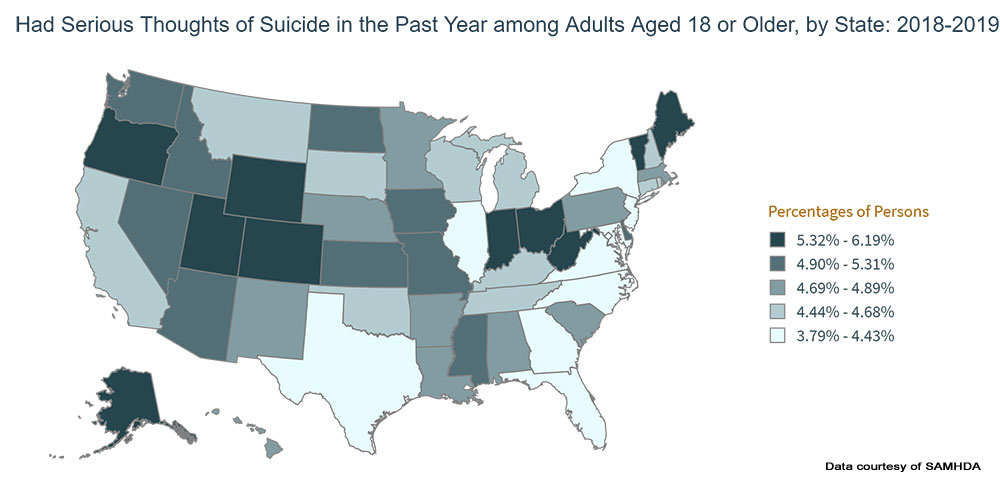
Had Serious Thoughts of Suicide Summary
- By State
- Highest incidence – Utah 6.2%
- Lowest incidence – New Jersey + at 3.8%
- Difference between high and low – 63.2%
NIMH Mental Health Statistics by type, gender and age
In recent statistics published by the National Institutes of Health’s ‘National Institute of Mental Health Disorders’, the following findings were highlighted:
- It is not uncommon for people with one mental health disorder to have a second or more coexisting disorder. For example, someone with anxiety, could also suffer from depression along with alcohol and / or substance abuse.
- Across the developed world as well as here in the US, mental health issues appear as many of the leading causes for disability and commonly include
- Diagnosable mental health conditions like substance abuse disorder or depressive disorders are common among individuals who commit suicide.
- For individuals from 15 to 24 years of age, suicide ranks as a leading cause of death
- Men attempt suicide less often than women do
- Suicide rates are four times higher for men than women
- Depressive illnesses which include dysthymia, major depressive and bipolar disorder will affect around 9.5% of the US population annually
- For people over the age of 18, those affected by bipolar disorder amounts to around 2.6% of the population
- On average, the first manic episode typically occurs around age 20
- Both women and men are share the same likelihood of developing bipolar disorder
- The likelihood of women suffering from a major depressive condition is almost double compared to men
- For those suffering with major depression, initial onset typically occurs in the mid 20s
- Annually, 26% of adults in America are personally impacted by diagnosable mental disorder
- Each year, anxiety disorders are found in roughly 18% of adults aged 18 to 54, and include:
- Phobias
- Social – onset generally occurs between childhood and adolescence
- Agoraphobia – typically between childhood and before the age of 35
- Specific phobia – usually appears first in children by the age of 10
- Panic disorder – Average onset occurs between the late teens and early adult years
- Generalized anxiety disorder (GAD) – most often occurring before middle age
- Post-traumatic stress disorder (PTSD) – Highest prevalence in early 40s for men and early 50s for women with median onset age of 23 for both genders
- Obsessive-compulsive disorder (OCD) – Symptoms generally appear from childhood to adolescence and can result in eating disorders or depressive disorders or substance abuse
- Phobias
- 1% of the population in the US suffer from schizophrenia, out of which:
- Generally seen in women from age 20 to their early 30s
- Between the late teen years to early 20s for males
CDC – Mental Health Statistics

Observations – In the CDC findings, with very few exceptions, there is a clear trend between the beginning and end of the survey period with everything trending upwards for the 18-29, 30-39,40-50 age brackets. For participants in the 50-59, 60-69, 70-79, and 80+ age groups, there was either very little change, or in some cases an improvement.
NEGATIVE TRENDS
| Category | Age Group | Start | End | Percentage change |
| Took prescription medication | 80+ | 13.8 | 17.9 | 29.7 |
| Received therapy or counselling | 30-39 | 11.7 | 14.8 | 26.5 |
| Medication and therapy or counselling | 40-49 | 23.6 | 36.9 | 56.4 |
| Needed but did not get therapy or counselling | 18-29 | 15.6 | 20.3 | 30.1 |
POSITIVE TRENDS
| Category | Age Group | Start | End | Percentage change |
| Took prescription medication | 70-79 | 18.4 | 16.9 | -8.15 |
| Received therapy or counselling | 80+ | 3 | 2.6 | -13.3 |
| Medication and therapy or counselling | 70-79 | 19.6 | 17.9 | -8.7 |
| Needed but did not get therapy or counselling | 70-79 | 2.9 | 3 | 3.4 |
A potential root cause for this result could be that with the older respondents who have more experience living through potentially life changing circumstances, their outlook on the future changed for the better once they were vaccinated.
As a broad generalization, while the trends in the younger age brackets did reflect larger increases in a negative context, the older respondents, who could technically be a more at risk group medically, appear to indicate a capacity to remain more resilient from a mental perspective.
The data from the same questions broken out by gender show the following:
| Female | Male | |||||
| Beginning | End | % Change | Beginning | End | % Change | |
| Took prescription medication | 24.6 | 26.3 | 6.9 | 13.7 | 14.4 | 5.2 |
| Received therapy / counselling | 10.6 | 12.1 | 15.2 | 6.7 | 7.9 | 17.9 |
| Received medication & therapy / counselling | 28 | 30.1 | 7.5 | 16.3 | 17.4 | 6.7 |
| Needed but didn’t get therapy / counselling | 11.4 | 13.5 | 18.4 | 6.8 | 8.5 | 25 |
Here we see that while the actuals differ for both males and females the two biggest increases are
- Received therapy / counselling (Females up 15.2% & Males up 17.9%)
- Needed but didn’t get therapy / counselling (Females up 18.4% & Males up 25%)
For the group which didn’t get the therapy or counselling they believe they should have, the increase for males was 35.9% more than it was for the female respondents.
CDC – Mental Health Statistics
Observations – In the CDC findings, with very few exceptions, there is a clear trend between the beginning and end of the survey period with everything trending upwards for the 18-29, 30-39,40-50 age brackets. For participants in the 50-59, 60-69, 70-79, and 80+ age groups, there was either very little change, or in some cases an improvement.
NEGATIVE TRENDS
| Category | Age Group | Start | End | Percentage change |
| Took prescription medication | 80+ | 13.8 | 17.9 | 29.7 |
| Received therapy or counselling | 30-39 | 11.7 | 14.8 | 26.5 |
| Medication and therapy or counselling | 40-49 | 23.6 | 36.9 | 56.4 |
| Needed but did not get therapy or counselling | 18-29 | 15.6 | 20.3 | 30.1 |
POSITIVE TRENDS
| Category | Age Group | Start | End | Percentage change |
| Took prescription medication | 70-79 | 18.4 | 16.9 | -8.15 |
| Received therapy or counselling | 80+ | 3 | 2.6 | -13.3 |
| Medication and therapy or counselling | 70-79 | 19.6 | 17.9 | -8.7 |
| Needed but did not get therapy or counselling | 70-79 | 2.9 | 3 | 3.4 |
A potential root cause for this result could be that with the older respondents who have more experience living through potentially life changing circumstances, their outlook on the future changed for the better once they were vaccinated.
As a broad generalization, while the trends in the younger age brackets did reflect larger increases in a negative context, the older respondents, who could technically be a more at risk group medically, appear to indicate a capacity to remain more resilient from a mental perspective.
The data from the same questions broken out by gender show the following:
Female
| Beginning | End | % Change | |
| Took prescription medication | 24.6 | 26.3 | 6.9 |
| Received therapy / counselling | 10.6 | 12.1 | 15.2 |
| Received medication & therapy / counselling | 28 | 30.1 | 7.5 |
| Needed but didn’t get therapy / counselling | 11.4 | 13.5 | 18.4 |
Male
| Beginning | End | % Change | |
| Took prescription medication | 13.7 | 14.4 | 5.2 |
| Received therapy / counselling | 6.7 | 7.9 | 17.9 |
| Received medication & therapy / counselling | 16.3 | 17.4 | 6.7 |
| Needed but didn’t get therapy / counselling | 6.8 | 8.5 | 25 |
Here we see that while the actuals differ for both males and females the two biggest increases are
- Received therapy / counselling (Females up 15.2% & Males up 17.9%)
- Needed but didn’t get therapy / counselling (Females up 18.4% & Males up 25%)
For the group which didn’t get the therapy or counselling they believe they should have, the increase for males was 35.9% more than it was for the female respondents.
By looking at these findings, one can quickly spot trends within most segments of the findings like age, gender, and race. If you know someone of a particular race, age and gender whose segments report a higher incidence for mental illness, it could be a strong indicator that your friend may be struggling and reaching out to see how they are doing would be a caring step to take. This would be especially true for groups that show low rates of having received care.
Thank you so much for your interest in learning more about mental health awareness and for doing what you can to help during May 2021 and for the remainder of the year.
~ Jerry Avenaim
Sources SAMHSA – SAMHDA Interactive NSDUH State Estimates | Johns Hopkins Medicine | NIMH – Mental Illness Statistics | Cohen Veterans Network | Harris Poll | Cohen Veterans Network – Americas Health | CDC – Mental Health Care | Mayo Clinic – Agoraphobia | NCBI – PTSD | Mayo Clinic – Specific Phobias | CDC – Anxiety and Depression
Subscribe to get notifications about future articles.
About the Author: Jerry Avenaim – Contributor


